First, I googled around, and read this article at theregister and this one at the examiner. Naturally, there was a big, ominous sun picture :-)
 Scary! Here's a video of the class C3 solar flare happening in real time:
Naturally, after reading that article, I thought to myself, "I wonder what the stati! stical significance of this event is, and what the probability! and co-occurrence bi-frequency distribution and temporal periodicity squared coefficient might be?"
I opened up my trusty iPhone... and... NO APP FOR THAT!!! What now, Steve Jobs, what now?!?! Oh no...! a mathematical question that deserves an answer, but didn't raise enough VC funding to make a bloated iPhone app that answers a simple question, but with slide-show effects, really pretty jelly buttons, and 3D shadows underneath it!

Luckily, as any good astro-physicist or geoscientist would tell you, one of the most famous data sets in the world is the Wolfer Sunspot Series, which is practically a rite of passage for starving astro-physics PhD students worldwide, and a great way to get published.
Thanks to Gareth Janacek, and his collection of data series, I was able to find the Wolfer data quickly, and used wget to pull it down to my calculator.
wget http://www.uea.ac.uk/~gj/book/data/wolfer.dat
Quite simple. Then I booted up R using a little script that I have automatically load when my calculator boots It basically runs this command:
export DISPLAY=:0.0
xterm -bg black -fg green -bw 0 -e 'R'
When R was running with the Matrix color theme, I then imported the data into a matrix (which is somehow nicely recursive):

Then I ran a command that launched up a little graphic:
dev.new(width=5,height=2.5);
par(mar=c(0,0,0,0),oma=c(2,2,2,2),bg="black);
plot(c(1:length(x)),x,type="l",col="white");
box("plot",col="white")
Literally this can be copied and pasted ri! ght into the Open Source Graphing Calculator's R command line:!
 And voila!
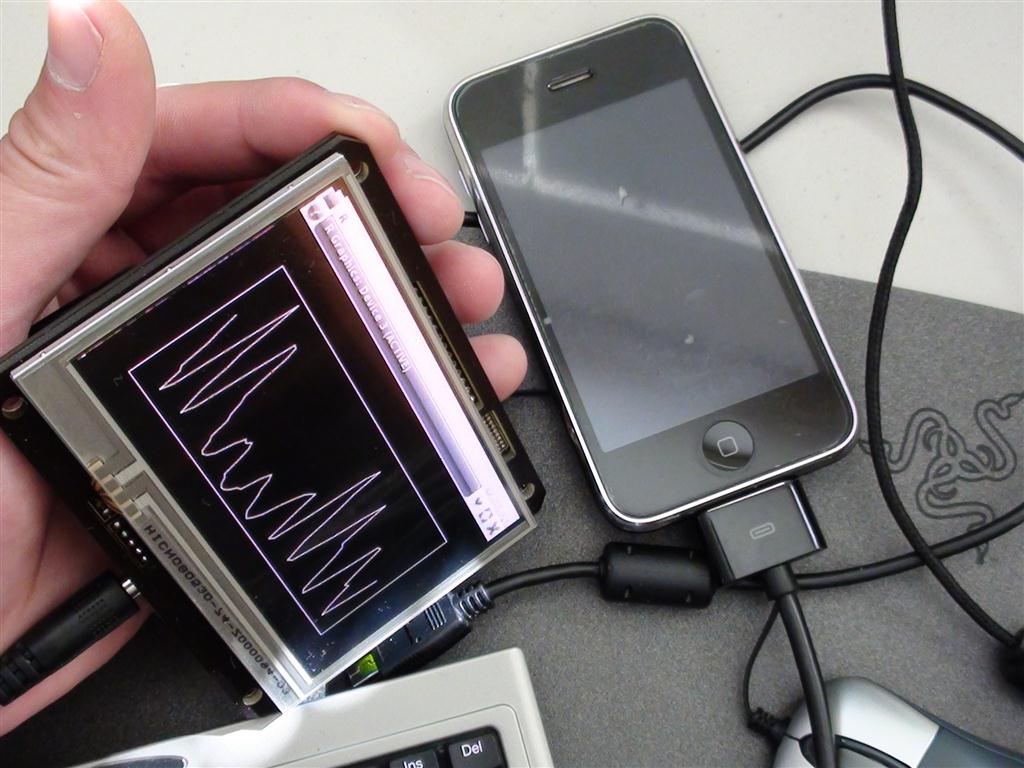
My iPhone is speechless. It can only sit there, black screened, wishing there was an app for that. I mean, technically, there is a $36 app call "Helios" that has funky graphics, but it doesn't answer my question: is this a regular thing, or really statistically random?
The answer: it happens all the time, and flares tend to be cyclical on a fairly predictable manner.
Open Source Graphing Calculator: 1
iPhone / Android / Ti-82 / HP-50g: 0
:-)
frequency distribution calculator
Pertarungan Sabung Ayam Paling Populer Didunia..Sabung Ayam S128
ReplyDeleteDapatkan Jadwal Sabung Ayam Setiap Hari Disini Ayam88.net
Cara Mendaftar Sabung Ayam Disini Sabung Ayam S128 dan SV388